I launched CardShows.io in the middle of March 2026.
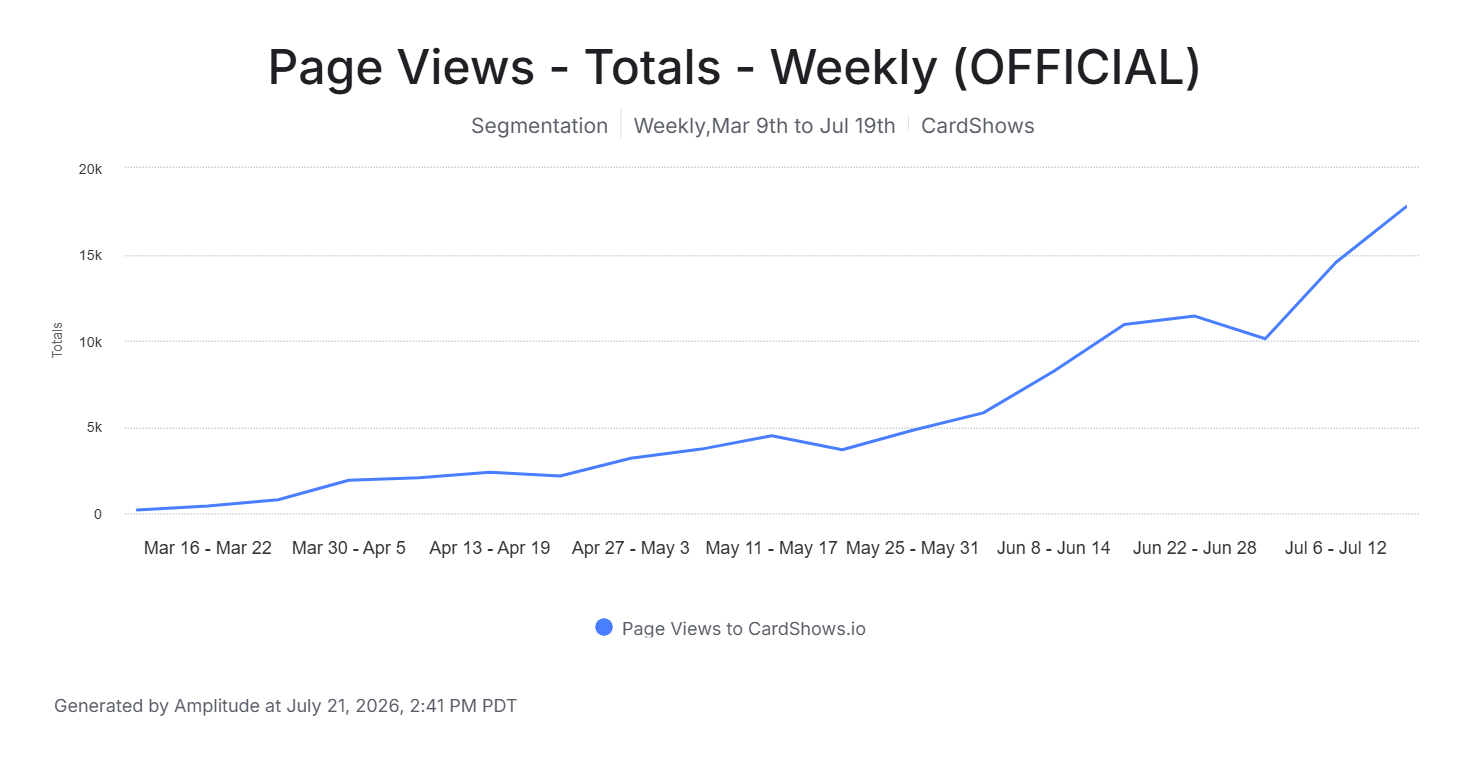
Four months later, the site just had another all-time-high week: 5,709 clicks and 237,600 impressions from Google, along with 17,755 total page views according to Amplitude. Give or take a few slower weeks, traffic has continued to hit new highs almost every week.
There weren't really any fancy tricks behind it. I didn't start with a big link-building campaign, and I wasn't trying to rank for the highest-volume keywords in the space.
Most of the work came down to getting four things right:
- The underlying card show data.
- The taxonomy and site architecture.
- Scalable templates and internal linking.
- Indexation.
AI made a lot of the work possible, but not because I used it to generate thousands of generic articles. I used it to build the site, discover and clean data, and shorten the loop between analytics and action.
I wouldn't call this a formal programmatic SEO (pSEO) case study. It's really a write-up of how I approached building and launching an SEO-first site, what I prioritized, where I got stuck, and what started working once the pages were indexed.
Why I built CardShows.io
My name is Chris Tam. I'm a trading card enthusiast based in the SF Bay Area, and I go to card shows pretty regularly. My day job is in growth marketing, SEO, and AEO. I'm always looking for another local card show to attend.
The card show information is out there, but it's scattered everywhere. Some organizers have their own websites. A lot of them promote primarily on Instagram or Facebook. Others use Eventbrite, ticketing platforms, or flyers posted inside local collecting groups.
There wasn't one centralized place that I thought did a good job of aggregating local shows with a decent level of coverage and accuracy.
CardShows.io sits directly at the intersection of my interests and my work. It was a chance to solve a problem I understood as a collector and practice programmatic SEO on something I owned.
And, honestly, I just like building things and making a number go up.
Why the first version stalled
I started working on the idea around October 2025. I tried Lovable, Bolt, and v0, and got a few prototypes running.
At the time, vibe coding didn't feel good enough for a non-coder like me to get this particular product over the line (or I just sucked at it).
Lovable and Bolt gave me good-looking front ends, but the versions I built relied heavily on client-side rendering. For an SEO-first directory, that was basically a nonstarter. I got the farthest with v0 because its Next.js output rendered server-side by default, and it connected directly with Vercel and Supabase.
Even then, I couldn't get the full application working the way I needed. I had to think through authentication, an admin panel, organizer submissions, recurring events, editing permissions, and review workflows. I could get pieces of it working, but I couldn't confidently put the whole thing together.
The data was at a standstill too.
Scraping a list of possible card shows was relatively easy. Turning that scrape into usable data was not. I needed to validate that events were real, remove duplicates, standardize venues and addresses, identify organizers, find the right social profiles and ticket pages, and keep all of it current.
I eventually put the project down.
What changed when I tried Claude Code
Then, in February 2026, I watched Greg Isenberg's “Claude Code built me a $273/Day online directory” podcast episode and decided to try again. This time I picked up Claude Code.
For the first time, I felt like I could work through the backend and application logic instead of stopping at a nice-looking prototype. I got the MVP to a place I was happy with in roughly a week. All in, I probably spent 20 to 30 hours on that first working version, but a lot of that was just me playing around, tinkering, and having fun building something after my kid went to sleep.
There is a common piece of advice: get the smallest possible MVP live and fix it incrementally. I generally agree with that, but I think the bar is different for an SEO-first site.
If your early product has a clunky button, you can fix the button next week. If you launch thousands of pages with bad data, a weak taxonomy, duplicate URLs, or a site architecture that search engines can't crawl properly, the cleanup can become the project. Google may already have discovered the wrong URLs and relationships, and correcting the structure can mean migrations, redirects, reindexation, and a lot of waiting.
For an SEO-first site, data quality and architecture aren't polish. They're part of the MVP.
Today, I do most of the building in Codex. I still haven't managed to hit the usage limits, GPT-5.6 is really good, and OpenAI's OAuth works with Hermes Agent. That last part matters a lot for the longer-running data workflows I use. I'll dive into that setup in a future post.
The hardest part of pSEO is the data
For an event page to be useful, I couldn't just have the name of a show and a date.
I wanted the venue, full address, hours, organizer, website, social profiles, ticket link, images, and whatever else someone would need before deciding to attend.
Those details are rarely available in one place. The official website might have the venue but an outdated date. Instagram might have the newest flyer. Eventbrite might have the ticket link. The organizer might use three slightly different names across those platforms.
The first approach got expensive
My first approach used the Brave Search API. I ran searches like:
[event name] website[event name] Instagram[event name] organizer[event name] Eventbrite
That first round of enrichment cost me roughly $300 to $400 in search credits. It produced good data, but I didn't want every new batch of events to cost hundreds of dollars.
During that process, I found OpenClaw and started experimenting with longer-running agent workflows. I got pretty deep into it, bought a Raspberry Pi 5, and set up jobs that could continue working overnight.
That was what made the data problem manageable. The agent could discover candidate shows while I slept. Then the records could be validated, deduplicated, cleaned, and enriched before I added them to the production database.
The monthly workflow I use now
I now use Hermes Agent by Nous Research for most of the ongoing work. Once a month, I have it go down the full list of states and look for new card shows. For every state, it works through roughly the same process:
- Find potential events from websites, social profiles, and event platforms.
- Check whether each event appears to be real and current.
- Remove duplicates and questionable records.
- Find the official website, organizer, social profiles, ticket pages, and images.
- Enrich the listing with useful details, a custom description, templated FAQs, images when applicable, and other context.
- Clean and structure the useful fields before they go into the site.
It still isn't perfect. Organizer data is especially messy. Venues and addresses are inconsistent. Shows get canceled or rescheduled. Sometimes a social post is more accurate than the official website, and Instagram scraping is pretty brittle unless you know what you're doing, which I don't.
But Hermes can do a large amount of the repetitive discovery and research. The current workflow has almost no marginal search cost beyond the AI subscriptions I already pay for. I also bought the Raspberry Pi 5 before prices jumped by roughly 50%, although I still regret not buying a Mac Studio.
My north star for data quality isn't a future where Hermes does all of this forever. It's to get more organizers to submit shows and edit their own information. Organizers are closest to the source, and giving them a good way to add or correct listings is the most scalable path to keeping the data accurate. That's the workflow I'm working toward now.
This is probably the biggest thing I've taken away from the project so far: AI has been much more valuable for gathering and organizing the underlying data than it would have been for generating a bunch of generic SEO copy.
I started with searches I had a realistic chance of ranking for
The obvious keywords in this space are terms like “card shows near me,” “card shows in California,” or “card shows in the Bay Area.”
I knew a brand-new domain probably wasn't going to rank well for those terms immediately. I didn't want the entire strategy to depend on them.
Instead, I started with individual event pages.
People search for specific card shows by name. Those queries are lower volume, but the intent is extremely clear. If someone searches for a specific show, they probably want the date, location, hours, tickets, or other event details.
That was an intent I knew the site could satisfy well.
Event pages now account for roughly 60% to 65% of organic traffic. They gave the site a way to earn traffic before it had enough authority to compete consistently for broader city and regional terms.
The taxonomy is really two parallel geographic structures:
Card shows
- Show detail pages
- Show city pages
- Show region pages
- Show state pages
Card shops
- Shop detail pages
- Shop city pages
- Shop region pages
- Shop state pages
Each show or shop detail page connects back to its city, region, and state. Show pages also connect to a venue and, when available, an organizer. Those relationships power the navigation and internal linking.
This is the part of programmatic SEO that I find the most interesting. I'm not going through thousands of pages and optimizing them individually. I'm improving the underlying data, relationships, and templates.
If I improve how the event template handles dates, related shows, nearby shops, or organizer information, that change can improve thousands of pages. If I improve the regional taxonomy, the internal-linking system gets better across the site.
The scale comes from working on the right layer.
The event pages were the first layer, but they were never supposed to be the only one. As those pages started winning long-tail searches, they also created the coverage and internal links that could help the city, region, and state hubs compete for broader terms.
Indexation was the first real bottleneck
I officially launched around the middle of March, but Google traffic didn't arrive immediately. It took about two weeks for pages to start getting indexed in a meaningful way.
At first, none of the important pages were indexed. After the first week, Google had indexed roughly 100 pages. I started changing the internal linking so it had clearer paths between the homepage, events, and all the geographic pages in between. I also made it easier for crawlers to move laterally between related pages instead of reaching a dead end. I also submitted my sitemaps and requested indexing in Google Search Console.
By the middle of April, approximately 3,400 pages were indexed. Today, that number is around 9,100, or roughly 81% of the pages on the site.
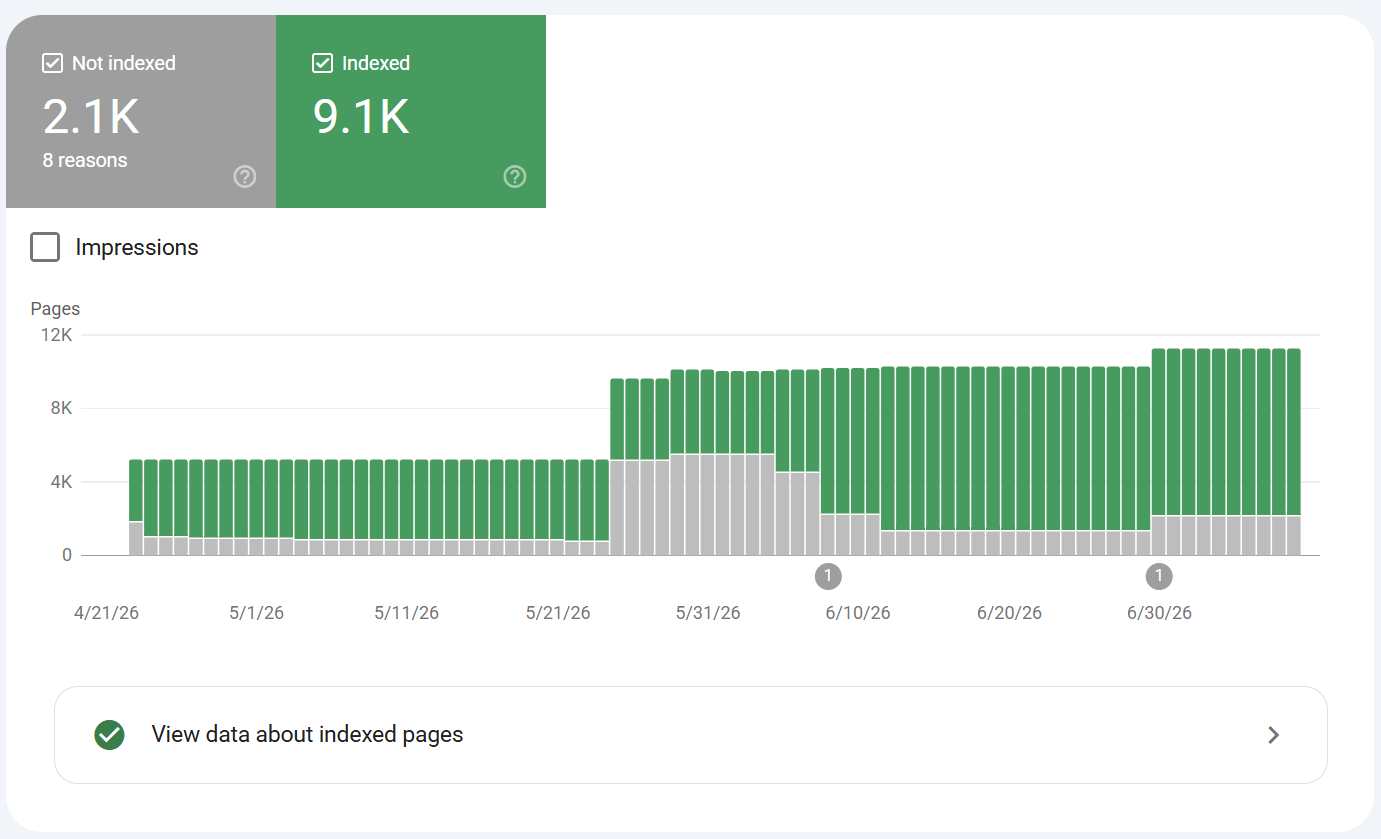
At the end of March, the site received 142 clicks and about 3,000 impressions in one week. The following week, it reached 762 clicks and 16,200 impressions.
By the end of May, weekly traffic was at approximately 1,750 clicks and 57,930 impressions. One week later, it reached 2,912 clicks and 126,000 impressions.
The site has now reached an all-time high of 5,709 weekly Google clicks and 237,600 weekly impressions, along with a weekly total of 17,755 page views. Across the full period shown, Search Console has recorded 36,800 clicks and 1.37 million impressions, with a 2.7% click-through rate and an average position of 8.1.
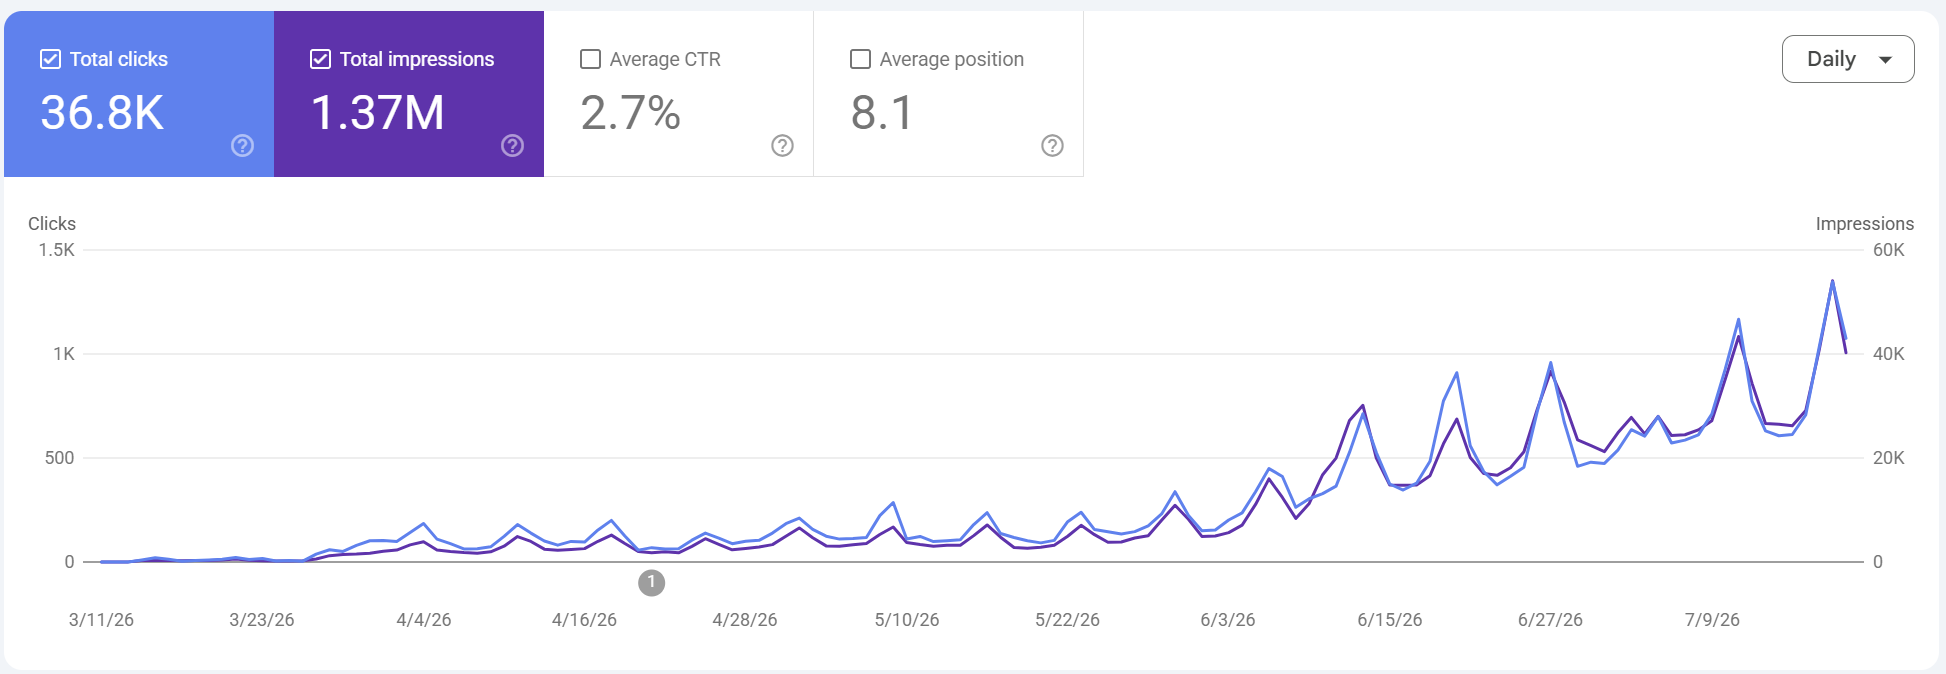
I didn't do much traditional link building during that period. I left a few relevant Reddit comments and submitted the site to three or four directories. That was basically it.
Most of the growth came from having useful pages for a large number of specific events, connecting those pages properly, and getting them indexed.
Winning the long tail started helping with head terms
The initial focus on event pages worked the way I hoped it would. CardShows.io started winning searches for specific shows, and those event pages became the foundation that helped the broader hub pages rank.
That has started translating into rankings for terms like “card shows in San Francisco”, “Cleveland card shows”, and other city and regional searches.
I didn't spend much time improving those hub pages at first because the event pages were the priority. The hubs existed and did their job structurally, but many of them still had basic content and layouts.
Now that the site is earning visibility for broader terms, I've started treating the hubs more like actual landing pages. I'm improving the content, layout, FAQs, event discovery experience, and the way they connect users to nearby shows, organizers, and shops.
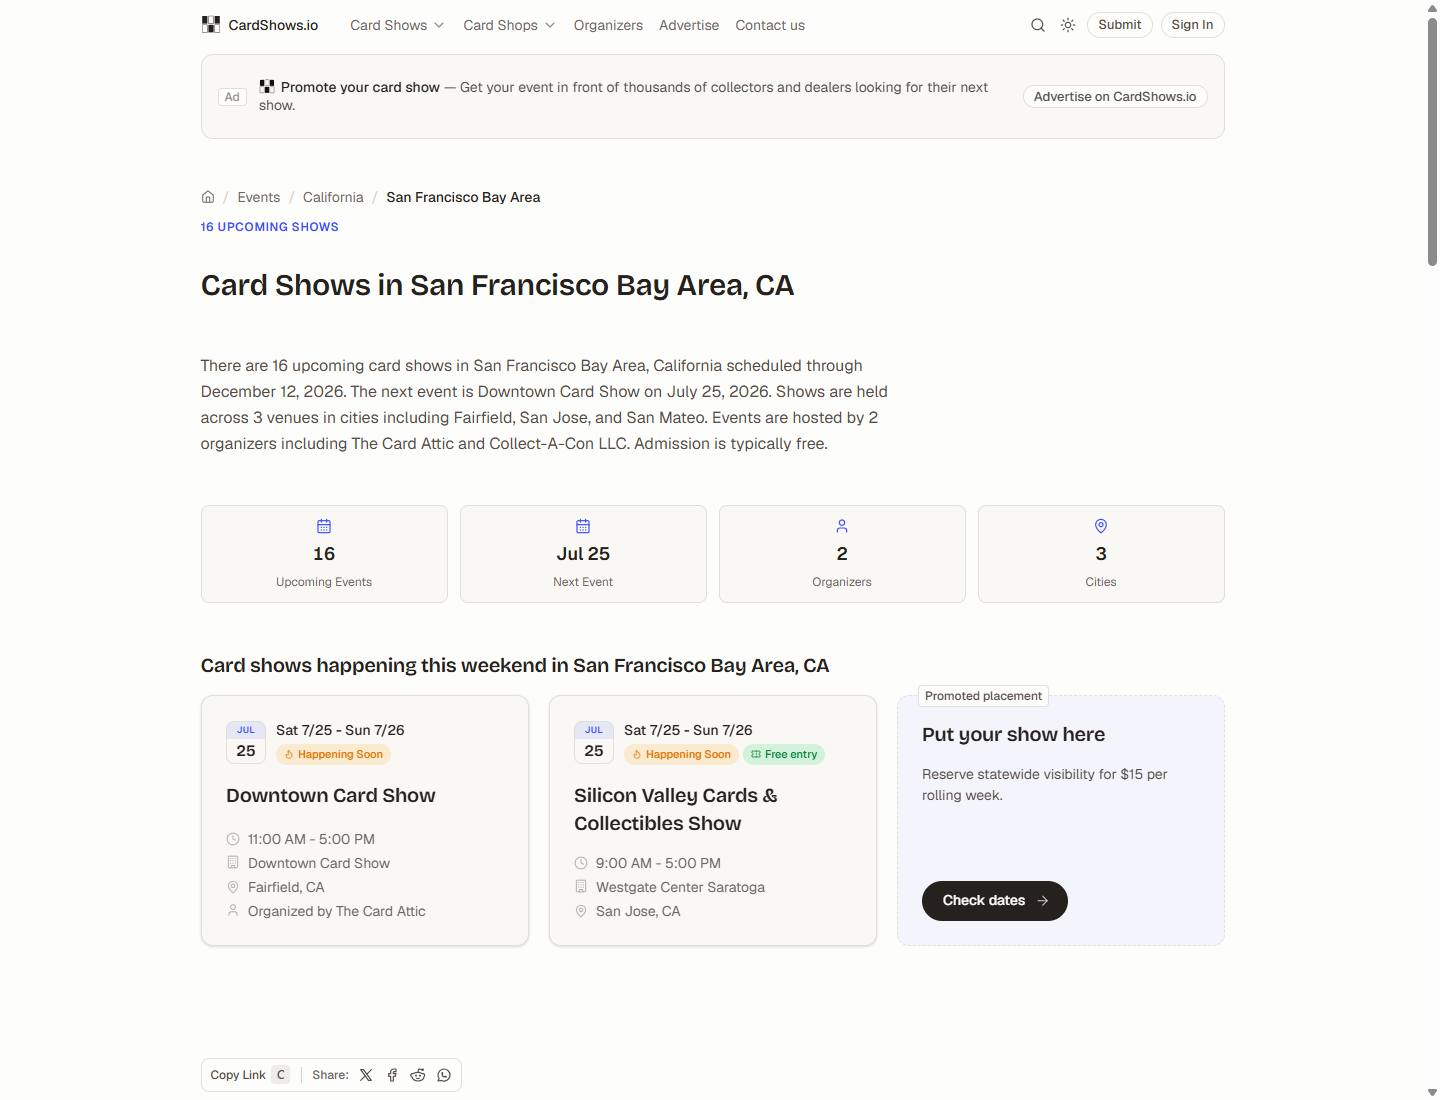
If you're building a similar structure, link the long-tail pages back to their hubs from the beginning. Those pages can generate traffic while also building the coverage and internal-linking signals the hubs need. Once the hubs begin earning impressions for broader queries, improve them as real landing pages instead of leaving them as lists of links. Better layouts, useful copy, FAQs, filters, and clearer paths into the underlying inventory all become more important at that stage.
The card shop rollout made the indexation effect obvious
Card shops produced the largest immediate lift, but the traffic didn't show up on the day I added the pages.
The rollout took about two weeks.
Opening the shop pages to Google
For the first week, I kept the shop pages noindexed and blocked them in robots.txt while I worked through the internal linking and cross-linking. Once the structure was where I wanted it, I removed those restrictions and opened the pages to Google.
The shop pages linked into the existing geography and event structure. Shows could surface nearby shops, shops could connect back to relevant locations, and city and regional pages had another useful type of local card content to organize.
Traffic started arriving about a week after I flipped the switch and Google began indexing the shop pages. Shops had more momentum than shows right out of the gate.
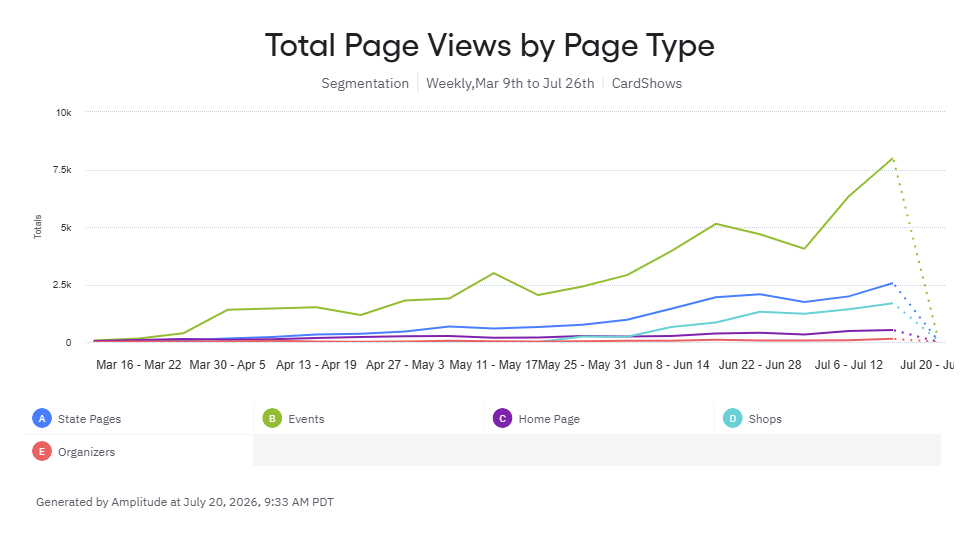
Amplitude shows the same lift from the product side. Shop pages went from essentially no traffic before the rollout to roughly 1,700 weekly page views in the latest complete week shown.
The page-type breakdown makes the progression easier to see. Event pages drove the initial growth, while shop traffic appeared later and began ramping quickly after the pages were opened to Google.
Following the same long-tail playbook
I haven't spent nearly as much time on shops as I have on events, so the click-through rate, data quality, and page experience still have plenty of room to improve.
I'm following the same SEO playbook I used for shows. Right now, the shop pages are in the long-tail phase. The goal is to win searches for specific shops, build coverage, and connect those pages into the geographic hubs. As that foundation gets stronger, I can put more effort into broader city and regional terms around card shops. There's more competition, like Google Maps and Yelp, so I anticipate traffic to take a while to ramp up.
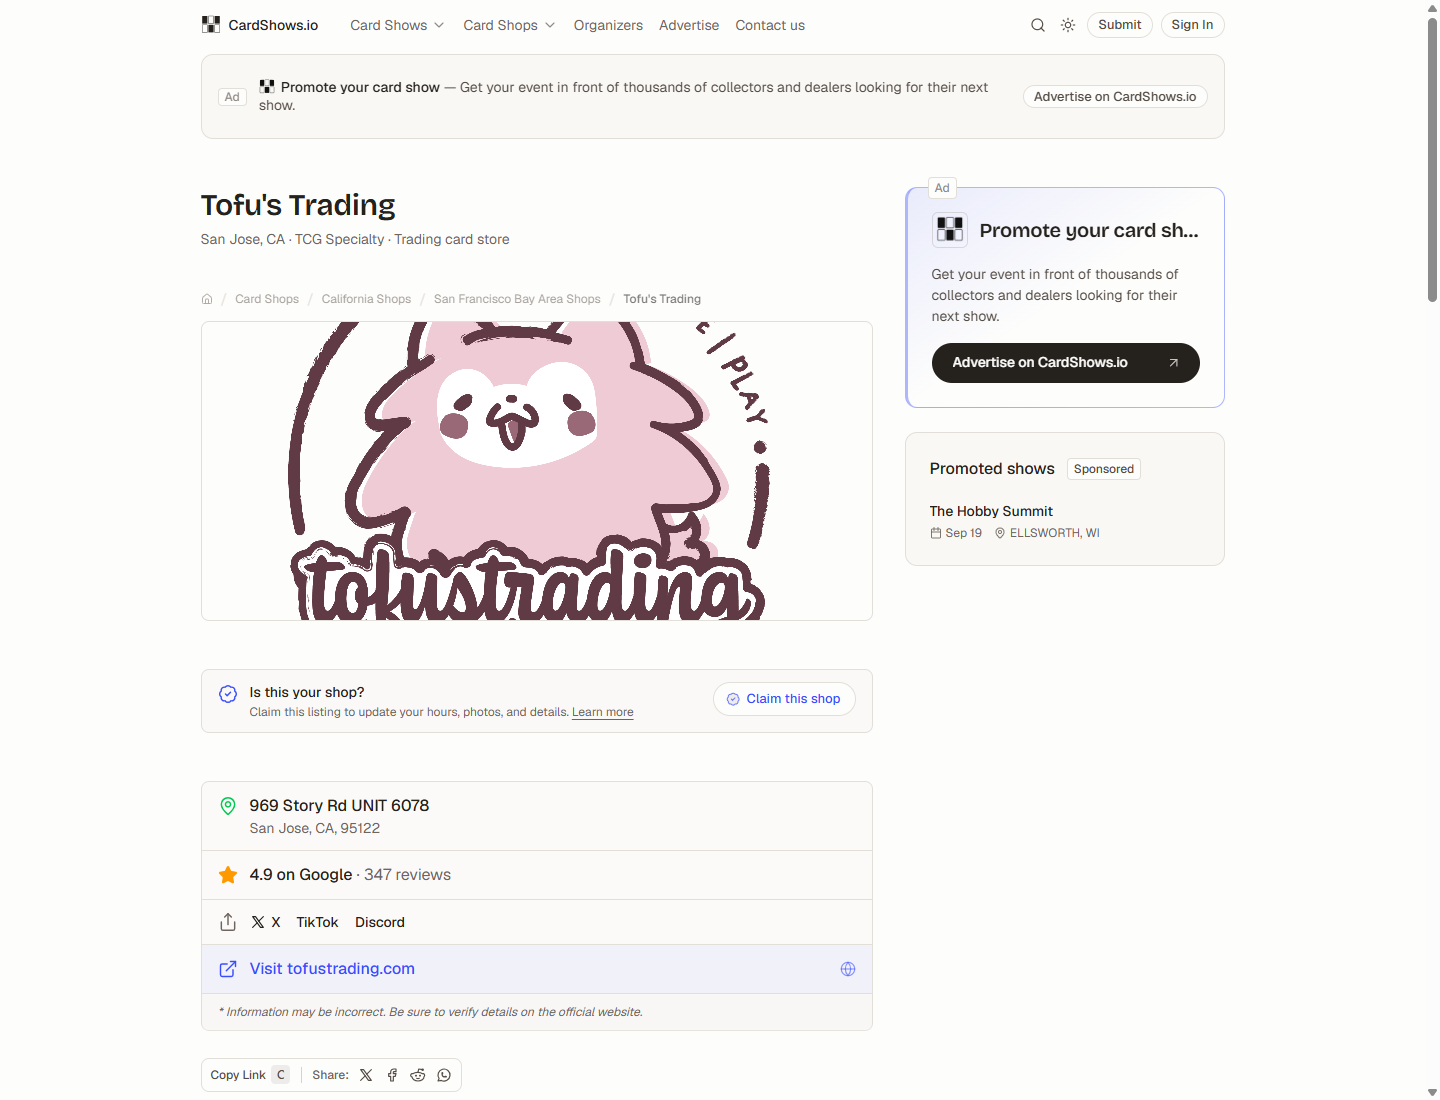
The shop images still kind of suck. I'm working on them, but they're a lower priority than improving the underlying data and experience.
The rest of the site grew too
The more interesting result was that the rest of the site grew around the same time. The lift wasn't isolated to shop pages.
I can't prove exactly why, but my working theory is that shops added a new layer of contextual relevance to the entire site. Cross-linking shows with nearby shops made the event pages richer. Shop pages gained context from the existing event and geographic structure. Together, they created a more complete picture of the local card ecosystem than either dataset could provide alone.
My analytics and operating loop lives in one place
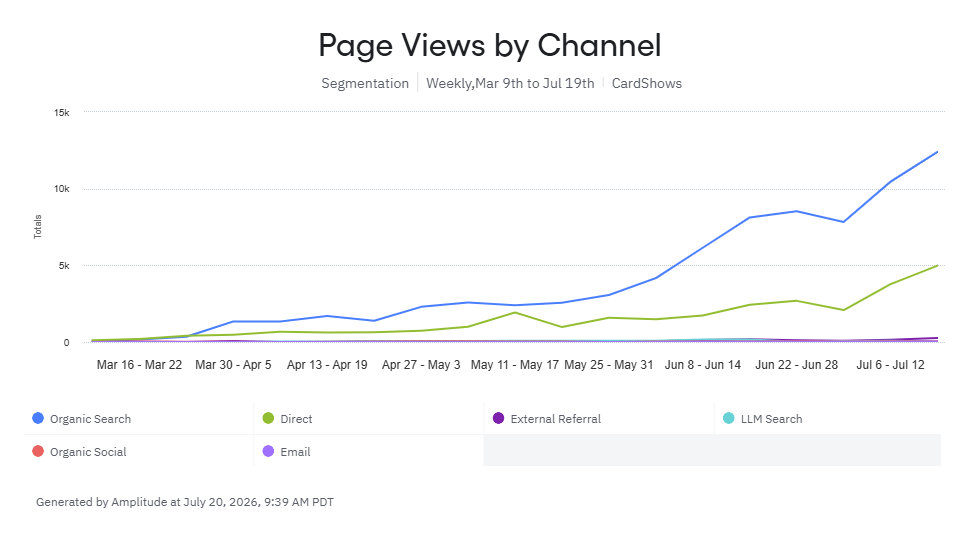
Organic search is the biggest channel, but one of the more interesting things in Amplitude is how direct traffic has grown alongside it. The overall trend is hard to miss: the site just reached a weekly total of 17,755 page views, with organic search driving the largest share and direct accounting for a meaningful amount of the rest.
Direct traffic isn't a perfect measurement of people typing in the domain or using a bookmark. It can also include private shares, untagged links, apps, and visits that lost their original attribution. Still, I think the trend is a good sign that some people first discover CardShows.io through search and then come back when they want to find another show.
How I run the weekly analysis
Codex has become the centralized app that I work out of. I have Amplitude connected through its MCP server, Search Console connected through its API, and the GitHub repository available in the same workspace. I switched from Claude to ChatGPT after Anthropic's OAuth changes made my OpenClaw and Hermes workflows less practical.
Every week, I ask it to break down traffic by channel, page type, and channel within each page type. I have it identify the pages and sections gaining or losing traffic, look at recent pull requests and code changes, and help me work through whether a drop looks technical, SEO-related, or part of a broader search change.
As I launch new features, I have Codex analyze what events I need to be tracking in Amplitude to build a funnel chart for my primary analytics dashboard.
From automated insight to action
Having those sources available together is extremely useful. I can overlay behavioral data, search performance, and what actually changed in the product without manually bouncing between a bunch of tools and reconstructing the timeline myself.
More importantly, it gets me from insight to action quickly. If shop pages grow, I can immediately inspect the queries, templates, internal links, and user behavior behind that growth. If every regional page drops together, I can look for a shared technical or architectural issue. If traffic goes up but people don't do anything useful after landing, that's a product problem rather than an acquisition win.
The efficiency doesn't come from automating a dashboard. It comes from having the analytics, the code, and the context in one place.
Organizer submissions became the next growth loop
The organizer submission flow was broken for a while after launch. I knew it needed work, but it wasn't part of the MVP I was trying to prove. My priority was making the event pages accurate and getting the data, taxonomy, templates, internal linking, and indexation working.
Once that foundation felt stable, I fixed the flow. Submissions went from roughly one event every two weeks to one per week, then two, and now about five organically submitted events per week.
That matters because Hermes is never going to find every local card show. Some events only exist as an Instagram flyer, a Facebook post, or information passed around inside a collector community. Organizer submissions fill those gaps and improve the database in places where the agent is flying a little blind.
The loop I want is simple: search brings collectors and organizers to the site, organizers submit more events, and those events create more useful pages that bring in more search traffic.
I'm applying the same sequencing elsewhere. I'm working on the vendor flow now, and I'll eventually improve the submission and management experience for card shops. I don't need every flow in the first version. I need each one when it becomes important to the next growth loop.
My biggest learnings from building a pSEO site
If I had to reduce the project to a few practical observations, they would be these:
-
Build a stronger foundation
- Treat structure as part of the MVP. An SEO-first MVP has a higher structural bar. Bad data, a weak taxonomy, poor URL design, and broken crawl paths can be much harder to unwind after thousands of pages have been discovered.
- Spend disproportionate time getting the data right. A scalable template doesn't help much if the underlying information is incomplete, duplicated, or wrong. In my case, roughly 80% of the initial work went into discovering, validating, deduplicating, cleaning, and enriching data. I don't know whether that is the right ratio for every project, but it was the right priority for this one.
- Design the taxonomy and internal linking together. City, region, state, organizer, event, and shop pages work because the relationships between them are useful to both visitors and search engines.
-
Earn traffic in layers
- Start with searches you can satisfy and realistically rank for. My domain and site were brand new, so I had no authority and broader terms were going to be tough to rank for. Specific event queries gave the site an entry point, and the event pages later helped city, region, and state hubs compete for broader terms.
- Actively ship and measure indexation. Publishing pages is not the same as getting them crawled, indexed, and ranked. If a new site is struggling, look at the levers you can actually pull: crawl paths, internal links, sitemaps,
robots.txt,noindexrules, canonicals, duplicate pages, response codes, and whether the pages are useful enough to index in the first place.
-
Build a faster operating loop
- Use AI for repetitive research and cleanup. Discovery, validation, deduplication, enrichment, and weekly analysis have been much more valuable to me than mass-producing written content.
- Bring the context into one workspace. Amplitude, Search Console, GitHub, and Codex are more useful together because I can move from a traffic change to a likely explanation and then into the work itself.
- Watch what happens after the click. Search Console tells me what Google is sending, but I also use funnel charts in Amplitude to see whether those visitors do anything useful. I track email subscriptions, RSVPs, add-to-calendar actions, organizer submissions, and other meaningful steps. That starts with making sure the right events are instrumented and actually firing correctly.
Why I keep working on it
This personal project is super fun because it lets me combine trading cards, SEO, product, analytics, and AI tooling in one place, then watch the results show up in the numbers.
It gives me a chance to touch parts of running a website that I don't normally spend as much time on in my day job. I'm doing product design and finding out that I really suck at parts of it. I'm thinking through ad inventory, organizer onboarding, vendor acquisition, lifecycle messaging, moderation, analytics instrumentation, and data operations.
Each area creates another problem to learn from. Improving one part usually exposes the next weak point, which is exactly what makes the project interesting to me.
What's next
The SEO foundation is working. Now I'm focused on making CardShows.io more useful for the collectors, organizers, vendors, and shops already showing up.
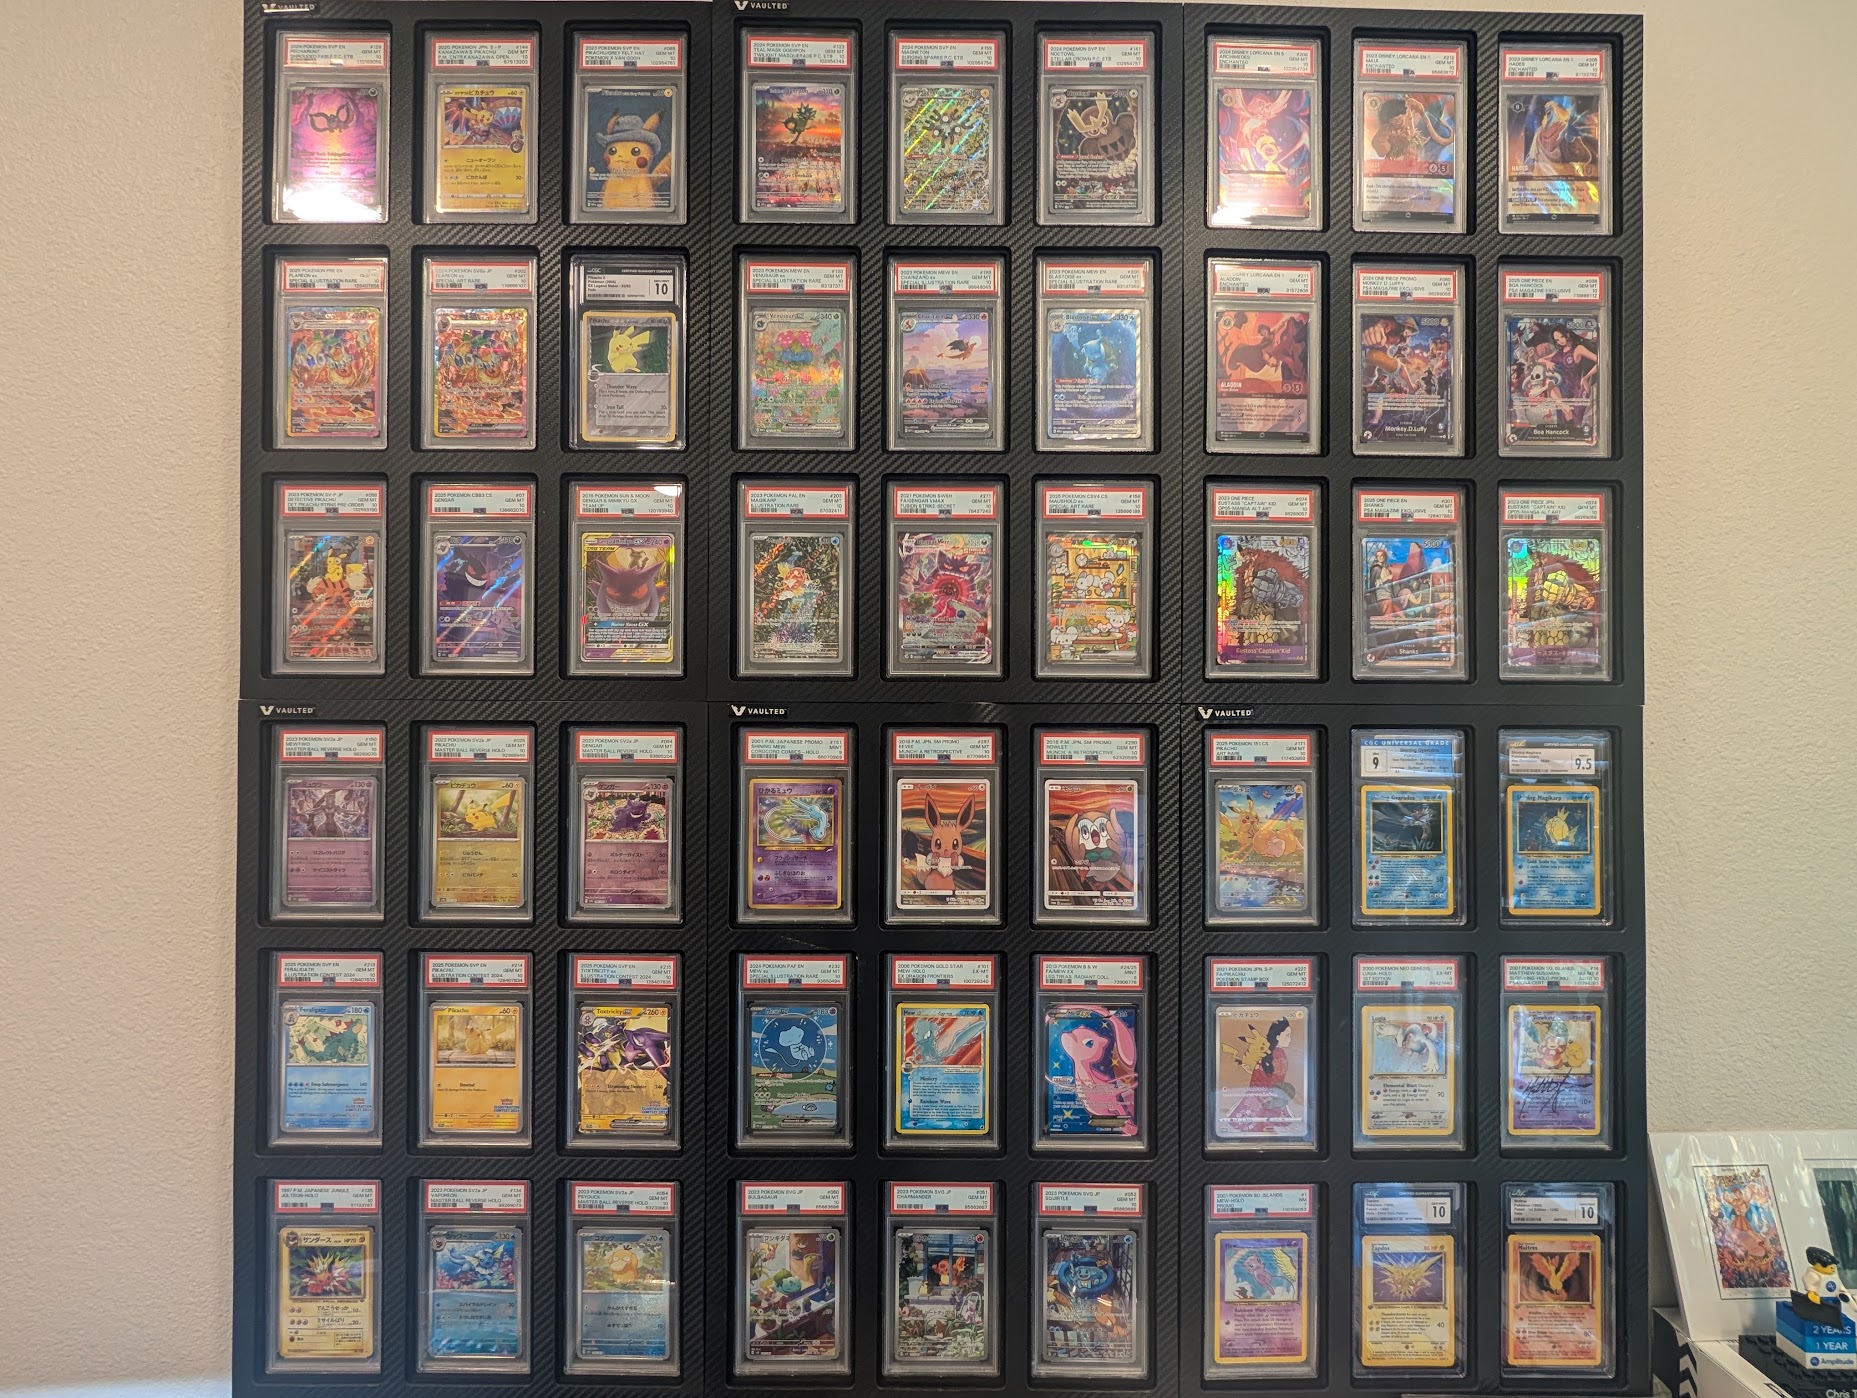
And because this whole thing started with the hobby, here's my slab collection. It doubles as my Zoom background during meetings.